刚才试了一下最新的dxprof 1.0.8,在KlayGE的例子程序上可以稳定执行了,不像以前一样会crash。
dxprof的网站是http://busyray.com/dxprof/index.html,介绍如下:
DxProf is realtime DirectX profiling tool for easy identification of performance bottlecks on the GPU. DirectX 9, DirectX 10, and DirectX 11 are supported.
Functionality
DXProf injects itself into applications that use DirectX for rendering. It analyzes each draw call in every frame and displays performance statistics for those draw calls, overlaying it over application frame buffer. It works with Direct X9, Direct X10, or Direct X11 applications.
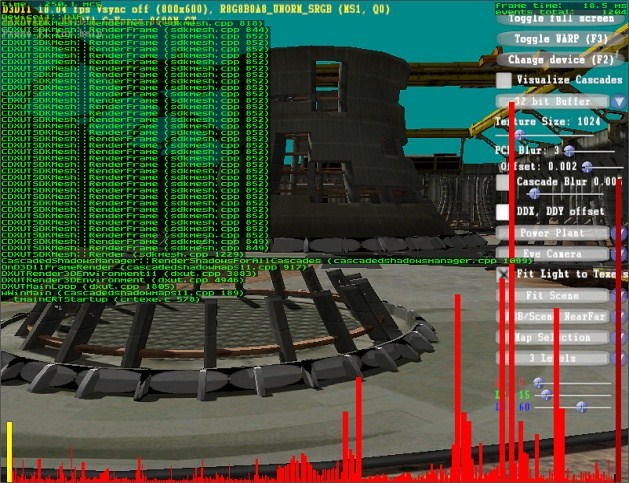
Report displayed by DXProf looks like this (rendering is done by “cascaded shadow map” sample from Microsoft Direct X SDK):
Each bar corresponds to draw call made by the application. Pressing ‘~’ (or shift-8) freezes the bars and enables call stack report – you can pick any bar you like and see file and line where this draw call was made. The last bar rendered in dark red is the cost of Present() call. High Present() bar indicates that application is CPU-bound.
Note that dxprof is able to report file and line for draw call only if valid .pdb files are available for running application. .pdb files have to be located in the same folder where application is located.


Comments